Easily debug Sitecore assemblies using dnSpy
Needing to debug into Sitecore assemblies isn’t uncommon, whether it be to track down the cause of a bug or simply understand a pipeline better. Traditionally, however, this process has been somewhat complicated by a number of factors:
- The JIT generates optimized code for assemblies without PDBs
- IIS ‘assembly shadow copy’ behaviour makes disabling JIT optimizations difficult
- Debugging without commercial tools like dotPeek is limited to either low-level IL or basic stack information
This guide attempts to alleviate all three of these barriers with free and open source tools.
Step 1: Enable debugging for Sitecore assemblies
Before we can attach a debugger, we need to solve two problems #1 and #2 above:
As outlined elsewhere (such as Anton’s excellent post), assembly optimizations can be disabled by adding an .ini file for each relevant assembly with the following contents:
[.NET Framework Debugging Control]
GenerateTrackingInfo=1
AllowOptimize=0
Assembly shadow copying can feature can be temporarily disabled by setting system.web/hostingEnvironment/@shadowCopyBinAssemblies to false
Making the changes above (and reverting them afterwards) is busy work that you’ll unlikely be wanting to do when debugging a problem, so I’ve automated the process into a simple PowerShell module (gist)
Import-Module .\Downloads\IISAssemblyDebugging.psm1
Enable-IISAssemblyDebugging c:\inetpub\wwwroot\sitecore.local

# Alternatively, you can disable optimisations for a limit subset:
Enable-IISAssemblyDebugging c:\inetpub\wwwroot\sitecore.local -Filter "Sitecore*.dll"
Step 2: Debug using dnSpy
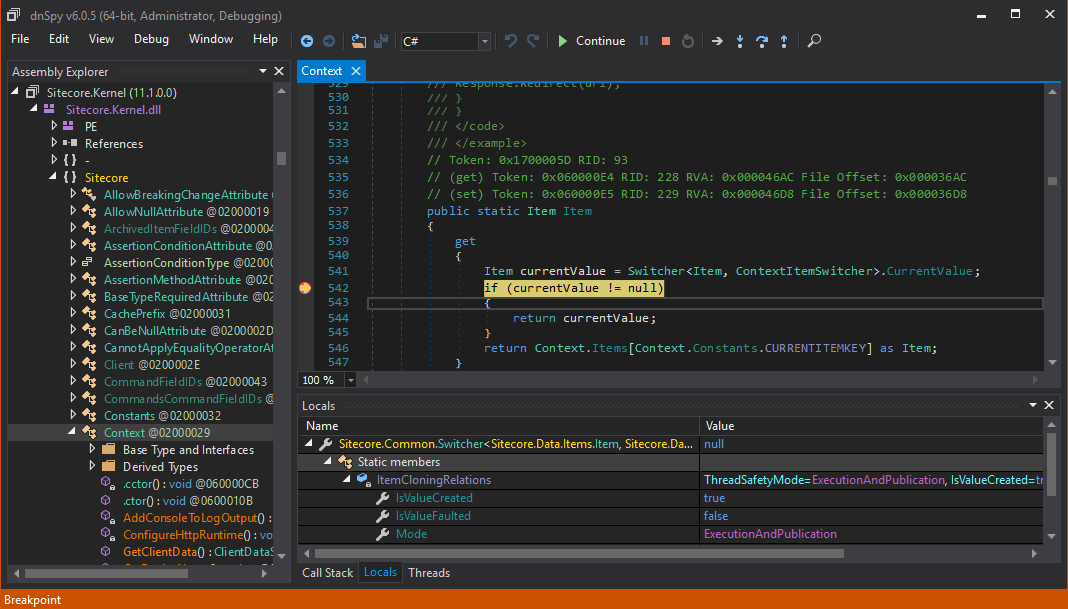
dnSpy is an excellent, open source, standalone .NET debugger that uses ILSpy to allow debugging into decompiled assemblies.
To begin, download dnSpy and run dnSpy.exe (as Administrator, since we’ll be attaching to IIS)
Next, select “Attach to Process” from the debug menu (or press CTRL+ALT+P) and select the appropriate w3wp.exe process (the Application Pool can be found in the “Command Line” column)
Now, select “Close All” from the File menu to clear the assembly list and then “Open” to select the assemblies you wish to debug.
Finally, set breakpoints and refresh the page in your browser. All the usual debugging views (Locals, Call Stack, etc) are available in the Debug :: Windows menu.

Step 3: Disable debugging for Sitecore assemblies
Once we’re done, revert the .ini and shadow copy configuration changes we made earlier:
Disable-IISAssemblyDebugging c:\inetpub\wwwroot\sitecore.local
You will also need to recycle your app pool to release the lock on the assemblies. Here’s an example using the IISAdministration module:
(Get-IISAppPool sitecore).Recycle()